
%201.svg)
An HR leader gets asked the same question every budget cycle: Did the training spend actually work?
Most teams answer with a completion rate. Ninety-four percent of employees finished the compliance course. The leadership team nods, and the conversation moves on, because a completion rate answers whether people clicked through slides, not whether anyone learned anything or whether the business is better off for it.
This is the gap a training KPI dashboard is supposed to close, and it is also where most HR teams get stuck. General HR KPI dashboards bury training under turnover and headcount metrics, treating it as one line among twelve rather than a category that deserves its own structure. The result is a reporting blind spot at the exact moment training budgets are under more scrutiny than they have been in years.
The business impact of getting this wrong is direct. Training budgets get cut first when finance cannot see a return, regardless of whether the training was actually working. Compliance gaps go undetected until an audit finds them, not when a dashboard would have flagged a completion rate slipping below the threshold. And L&D teams lose the internal argument for new content investment because they have activity numbers instead of outcome numbers to bring into the room.
Why this matters now: training investment is increasingly judged against the same rigor as any other line item, and HR teams that can show completion, retention, time-to-competency, and ROI side by side are the ones whose budgets survive the next review cycle. This guide breaks down the fifteen KPIs that belong on a real training dashboard, how to group them by business goal, the ROI formula that actually holds up under finance scrutiny, and the most common mistakes that quietly undermine otherwise solid dashboards.
What Is a Training KPI Dashboard?
A training KPI dashboard is a centralized, visual reporting tool that tracks the key performance indicators measuring how effective an organization's training programs are. Unlike a general HR dashboard, which monitors turnover, headcount, and compensation, a training KPI dashboard focuses specifically on learning activity, skill outcomes, and the business return on training investment. It typically combines activity metrics, such as completion rate and time to complete, with outcome metrics, such as knowledge retention, certification rate, and training ROI, grouped by business goal: compliance, onboarding, sales enablement, leadership development, and safety. The purpose is to give HR and L&D leaders a single, real-time view that answers not just whether employees finished a course, but whether the training changed performance and justified its cost.
Why Training KPIs Deserve Their Own Dashboard
General HR KPI dashboards are built around headcount, attrition, and compensation because those are the metrics finance and the C-suite ask about most often. Training gets folded in as a single line, usually completion rate or a rough cost figure, which means the data that would actually prove training works never gets surfaced.
The completion rate trap
Completion rate is the most commonly reported training metric and the least useful one on its own. It measures whether someone clicked through a course, not whether they retained anything or changed how they work. A 98 percent completion rate on a safety course tells you nothing about whether incident rates actually dropped.
Training as a cost center versus a measured investment
Without outcome-level KPIs, training defaults to being viewed as a fixed cost rather than an investment with a return. That framing makes it the first budget line cut when the business tightens spending, regardless of whether the programs in question were delivering measurable value.
Compliance exposure hides in aggregate numbers.
An overall completion rate of 95 percent can mask a single department or location sitting at 60 percent. That gap is exactly the kind of exposure that surfaces during an audit or after an incident, not before, unless the dashboard is built to break the number down rather than report it as one aggregate figure.
The 15 Essential Training KPIs Every HR Team Should Track
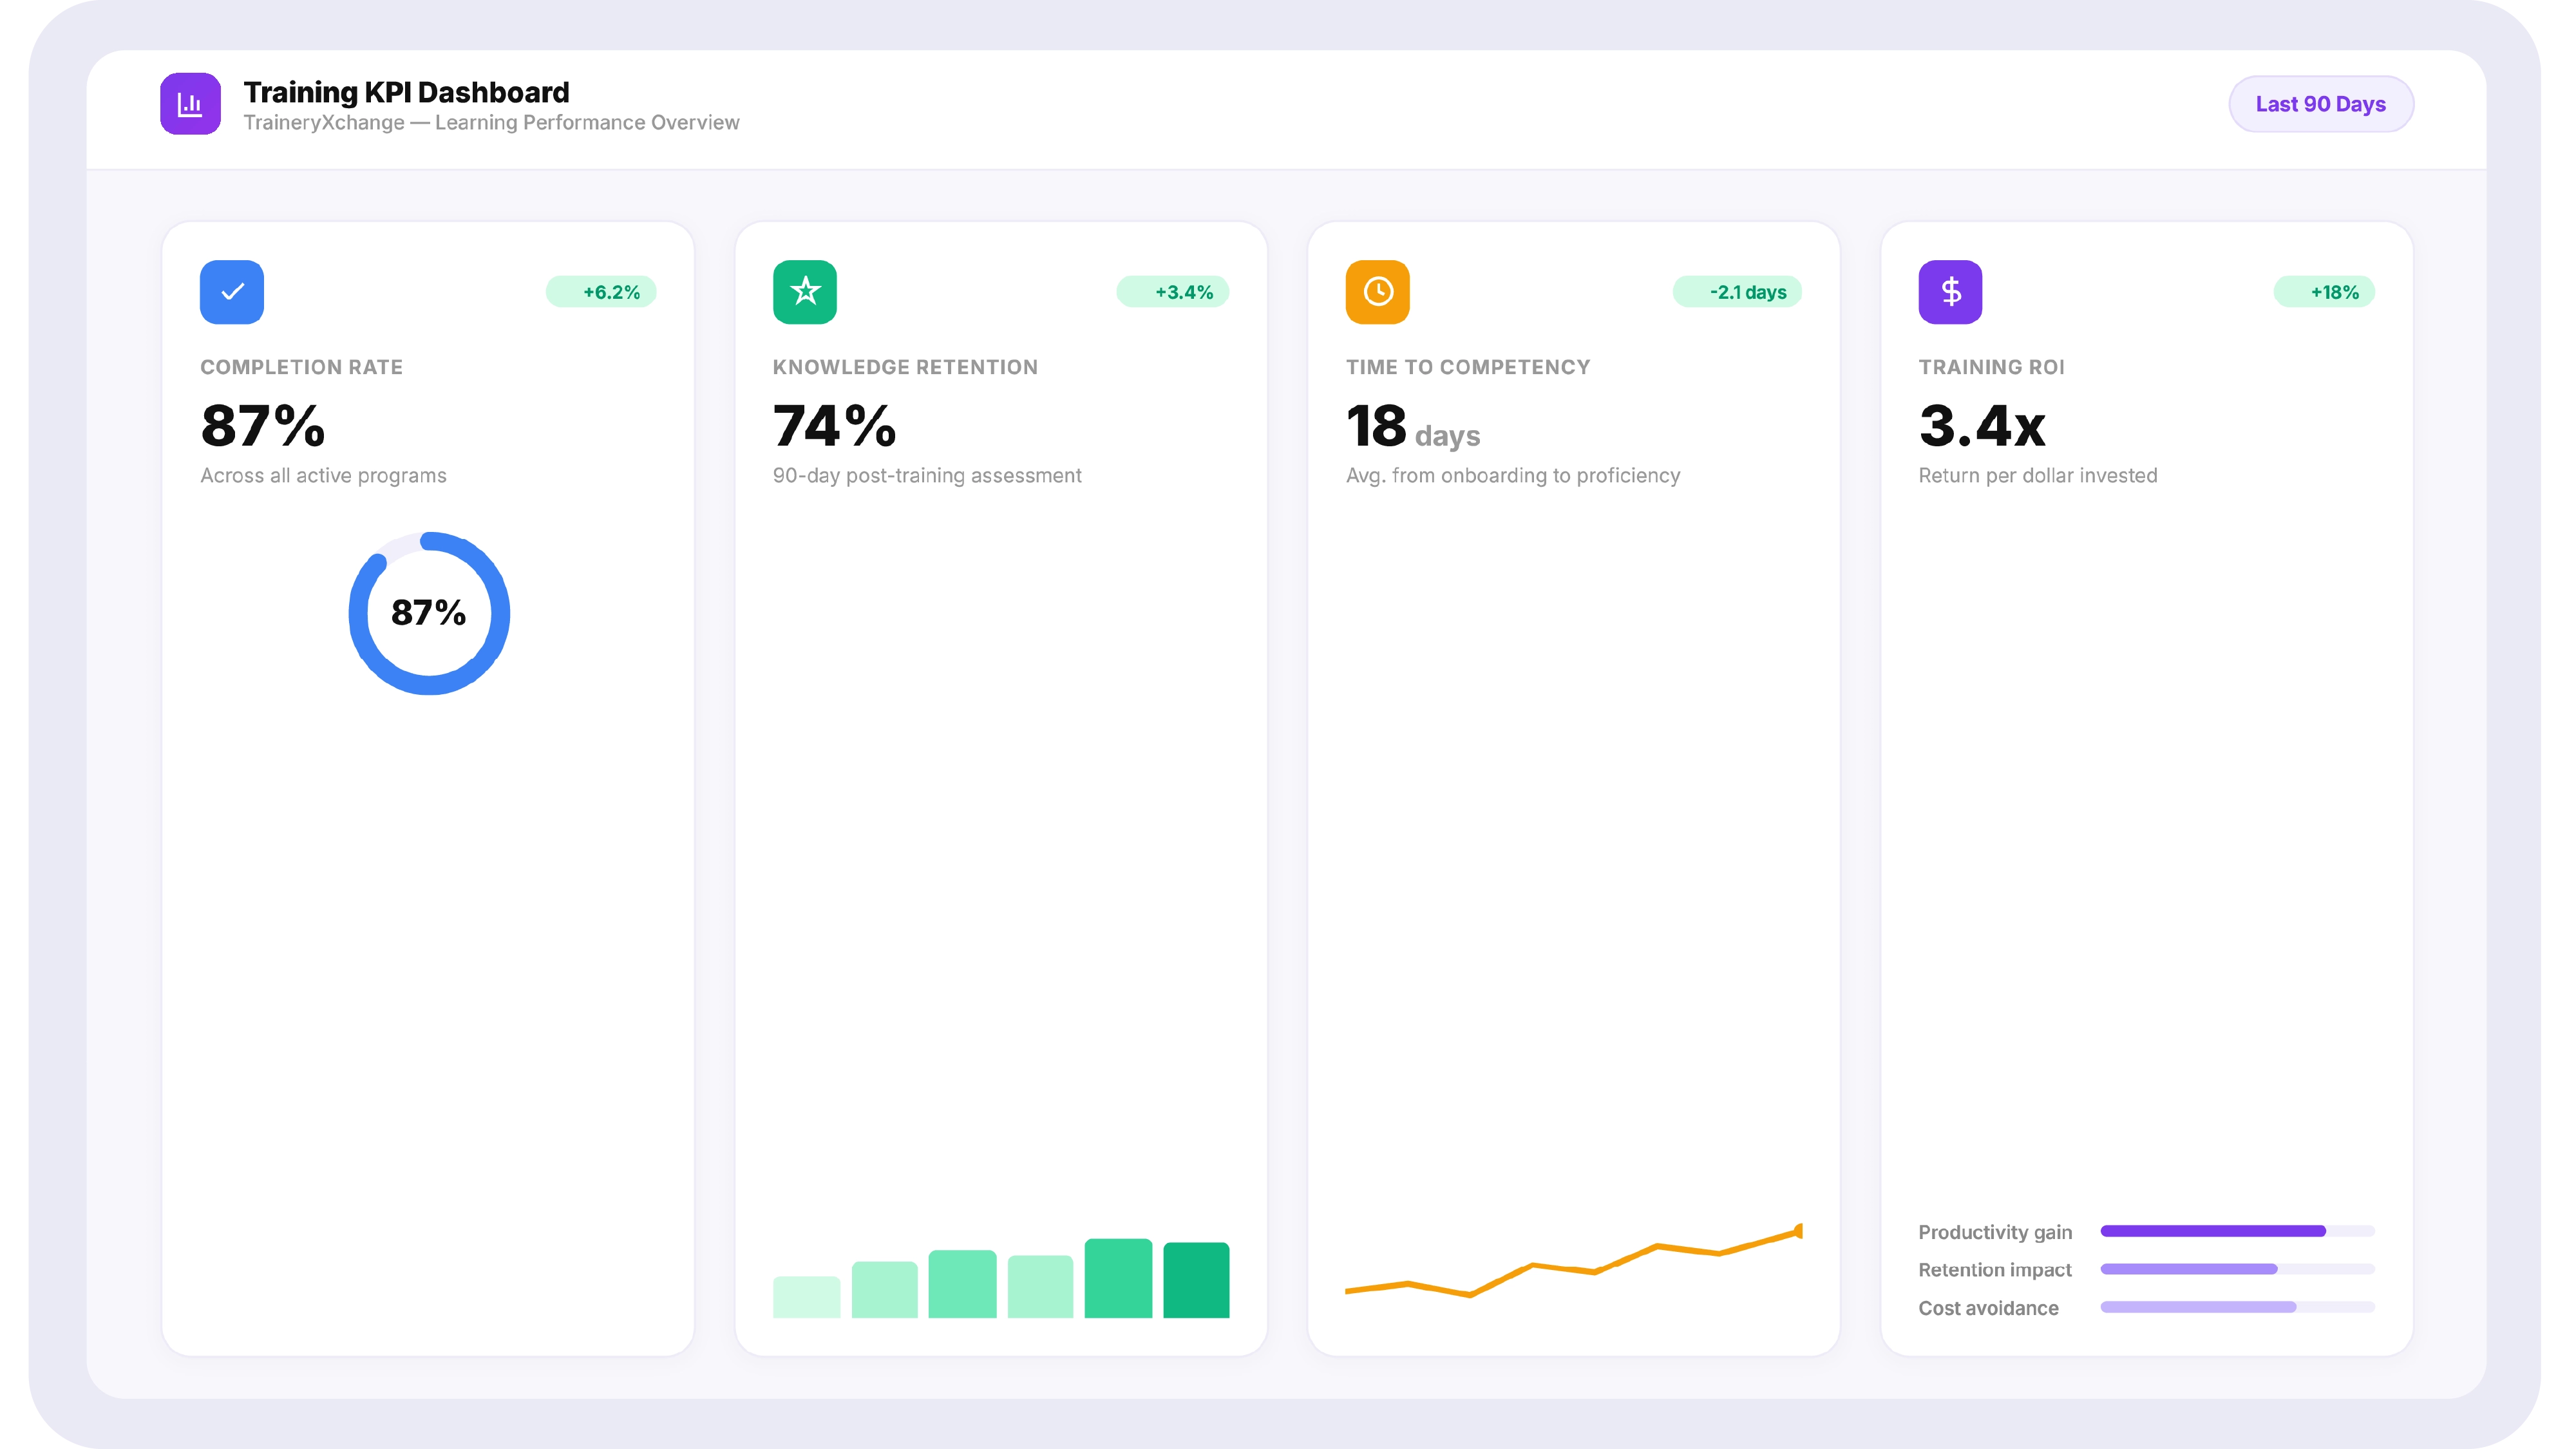
These fifteen metrics fall into two categories: activity metrics, which show whether training is happening, and outcome metrics, which show whether it worked. A dashboard built on activity metrics alone will always look healthier than the actual state of workforce capability.
Activity Metrics
- Completion Rate. The percentage of assigned learners who finish a course or program within the required window. Useful as a baseline, not as proof of effectiveness.
- Enrollment Rate. The percentage of eligible employees who start a course relative to those assigned. A gap between assignment and enrollment often signals a communication or access problem before it becomes a completion problem.
- Time to Complete. The average time learners take to finish a course relative to its expected duration. Consistently long completion times can indicate content that is too dense, poorly paced, or competing with the workload.
- Course Abandonment Rate. The percentage of learners who start but do not finish. High abandonment on a specific module is one of the fastest signals that content needs revision.
- Training Attendance Rate. For live or instructor-led sessions, the percentage of registered employees who actually attend. Relevant for leadership development and cohort-based programs where live engagement matters.
- Certification and Recertification Rate. The percentage of employees holding a required certification, current and not expired. Critical for compliance-heavy industries where lapsed certifications carry legal exposure.
Outcome Metrics
- Knowledge Retention Rate. Measured through follow-up assessments at 30, 60, or 90 days post-training, comparing scores against the original assessment. This is the metric most dashboards skip entirely, and the one that separates training that sticks from training that doesn't.
- Assessment or Quiz Pass Rate. The percentage of learners passing the knowledge check tied to a course on the first attempt. A consistently low first-attempt pass rate usually points to a content or difficulty mismatch, not a learner problem.
- Time to Competency. The time it takes a new hire or role transfer to reach defined proficiency, typically benchmarked against manager sign-off or a skills assessment. This is one of the clearest links between training investment and business speed.
- Skill Gap Closure Rate. The percentage of identified skill gaps closed within a defined period following targeted training. Requires a skills framework to define what counts as closed, but it is the most direct outcome metric tying training to workforce capability.
- Behavior Change or Application Rate. Captured through manager observation, follow-up surveys, or performance data showing whether learners actually apply what they learned on the job. Harder to measure than a quiz score, but it is the metric that most directly answers whether training changed anything real.
- Performance Improvement Post-Training. Comparing a measurable performance indicator, such as sales close rate or error rate, before and after a training intervention for the same group. This is the metric finance actually wants to see.
- Training-Linked Incident Rate. For safety and compliance training specifically, the rate of incidents or violations among trained employees relative to untrained or lapsed-certification employees. A direct line between training and risk reduction.
- Learner Satisfaction Score. Typically, a short post-course survey rates relevance, clarity, and applicability. A leading indicator: low satisfaction scores tend to predict declining completion and retention before those numbers move.
- Training ROI. The financial return on training investment is calculated by comparing the monetary value of the improvement against the program cost. Covered in detail in the next section, since this is the metric every executive dashboard should lead with.
Before you build this dashboard manually
If your team is currently exporting completion data from one system, assessment scores from another, and certification expiration dates from a spreadsheet, the dashboard work is mostly data wrangling, not analysis. It's worth understanding what an LMS with native reporting actually automates before investing time in a manual build that will need to be rebuilt the moment a new course library gets added. See what automated training reporting looks like
Training KPIs by Business Goal
The fifteen KPIs above apply differently depending on what the training is for. A compliance program and a sales enablement program should not be judged against the same priority metrics, even though both might appear on the same overall dashboard.
| Training Type | Primary KPIs | Why These Matter Most |
|---|---|---|
| Compliance | Completion rate, certification rate, and training-linked incident rate. | Legal exposure makes completion mandatory, while incident rates demonstrate whether training actually reduces risk. |
| Onboarding | Time to competency, knowledge retention, and learner satisfaction. | Faster productivity is the primary objective, while satisfaction scores help predict early employee retention. |
| Sales Enablement | Performance improvement after training, behavior change, and training ROI. | Sales performance provides clear before-and-after evidence, making ROI measurement more reliable. |
| Leadership Development | Behavior change, attendance rate, and skill gap closure. | Leadership success is measured by sustained behavior change and business impact rather than quiz scores. |
| Safety | Certification rate, training-linked incident rate, and recertification rate. | Certification compliance and incident reduction are the primary metrics used during audits and investigations. |
How to Calculate Training ROI
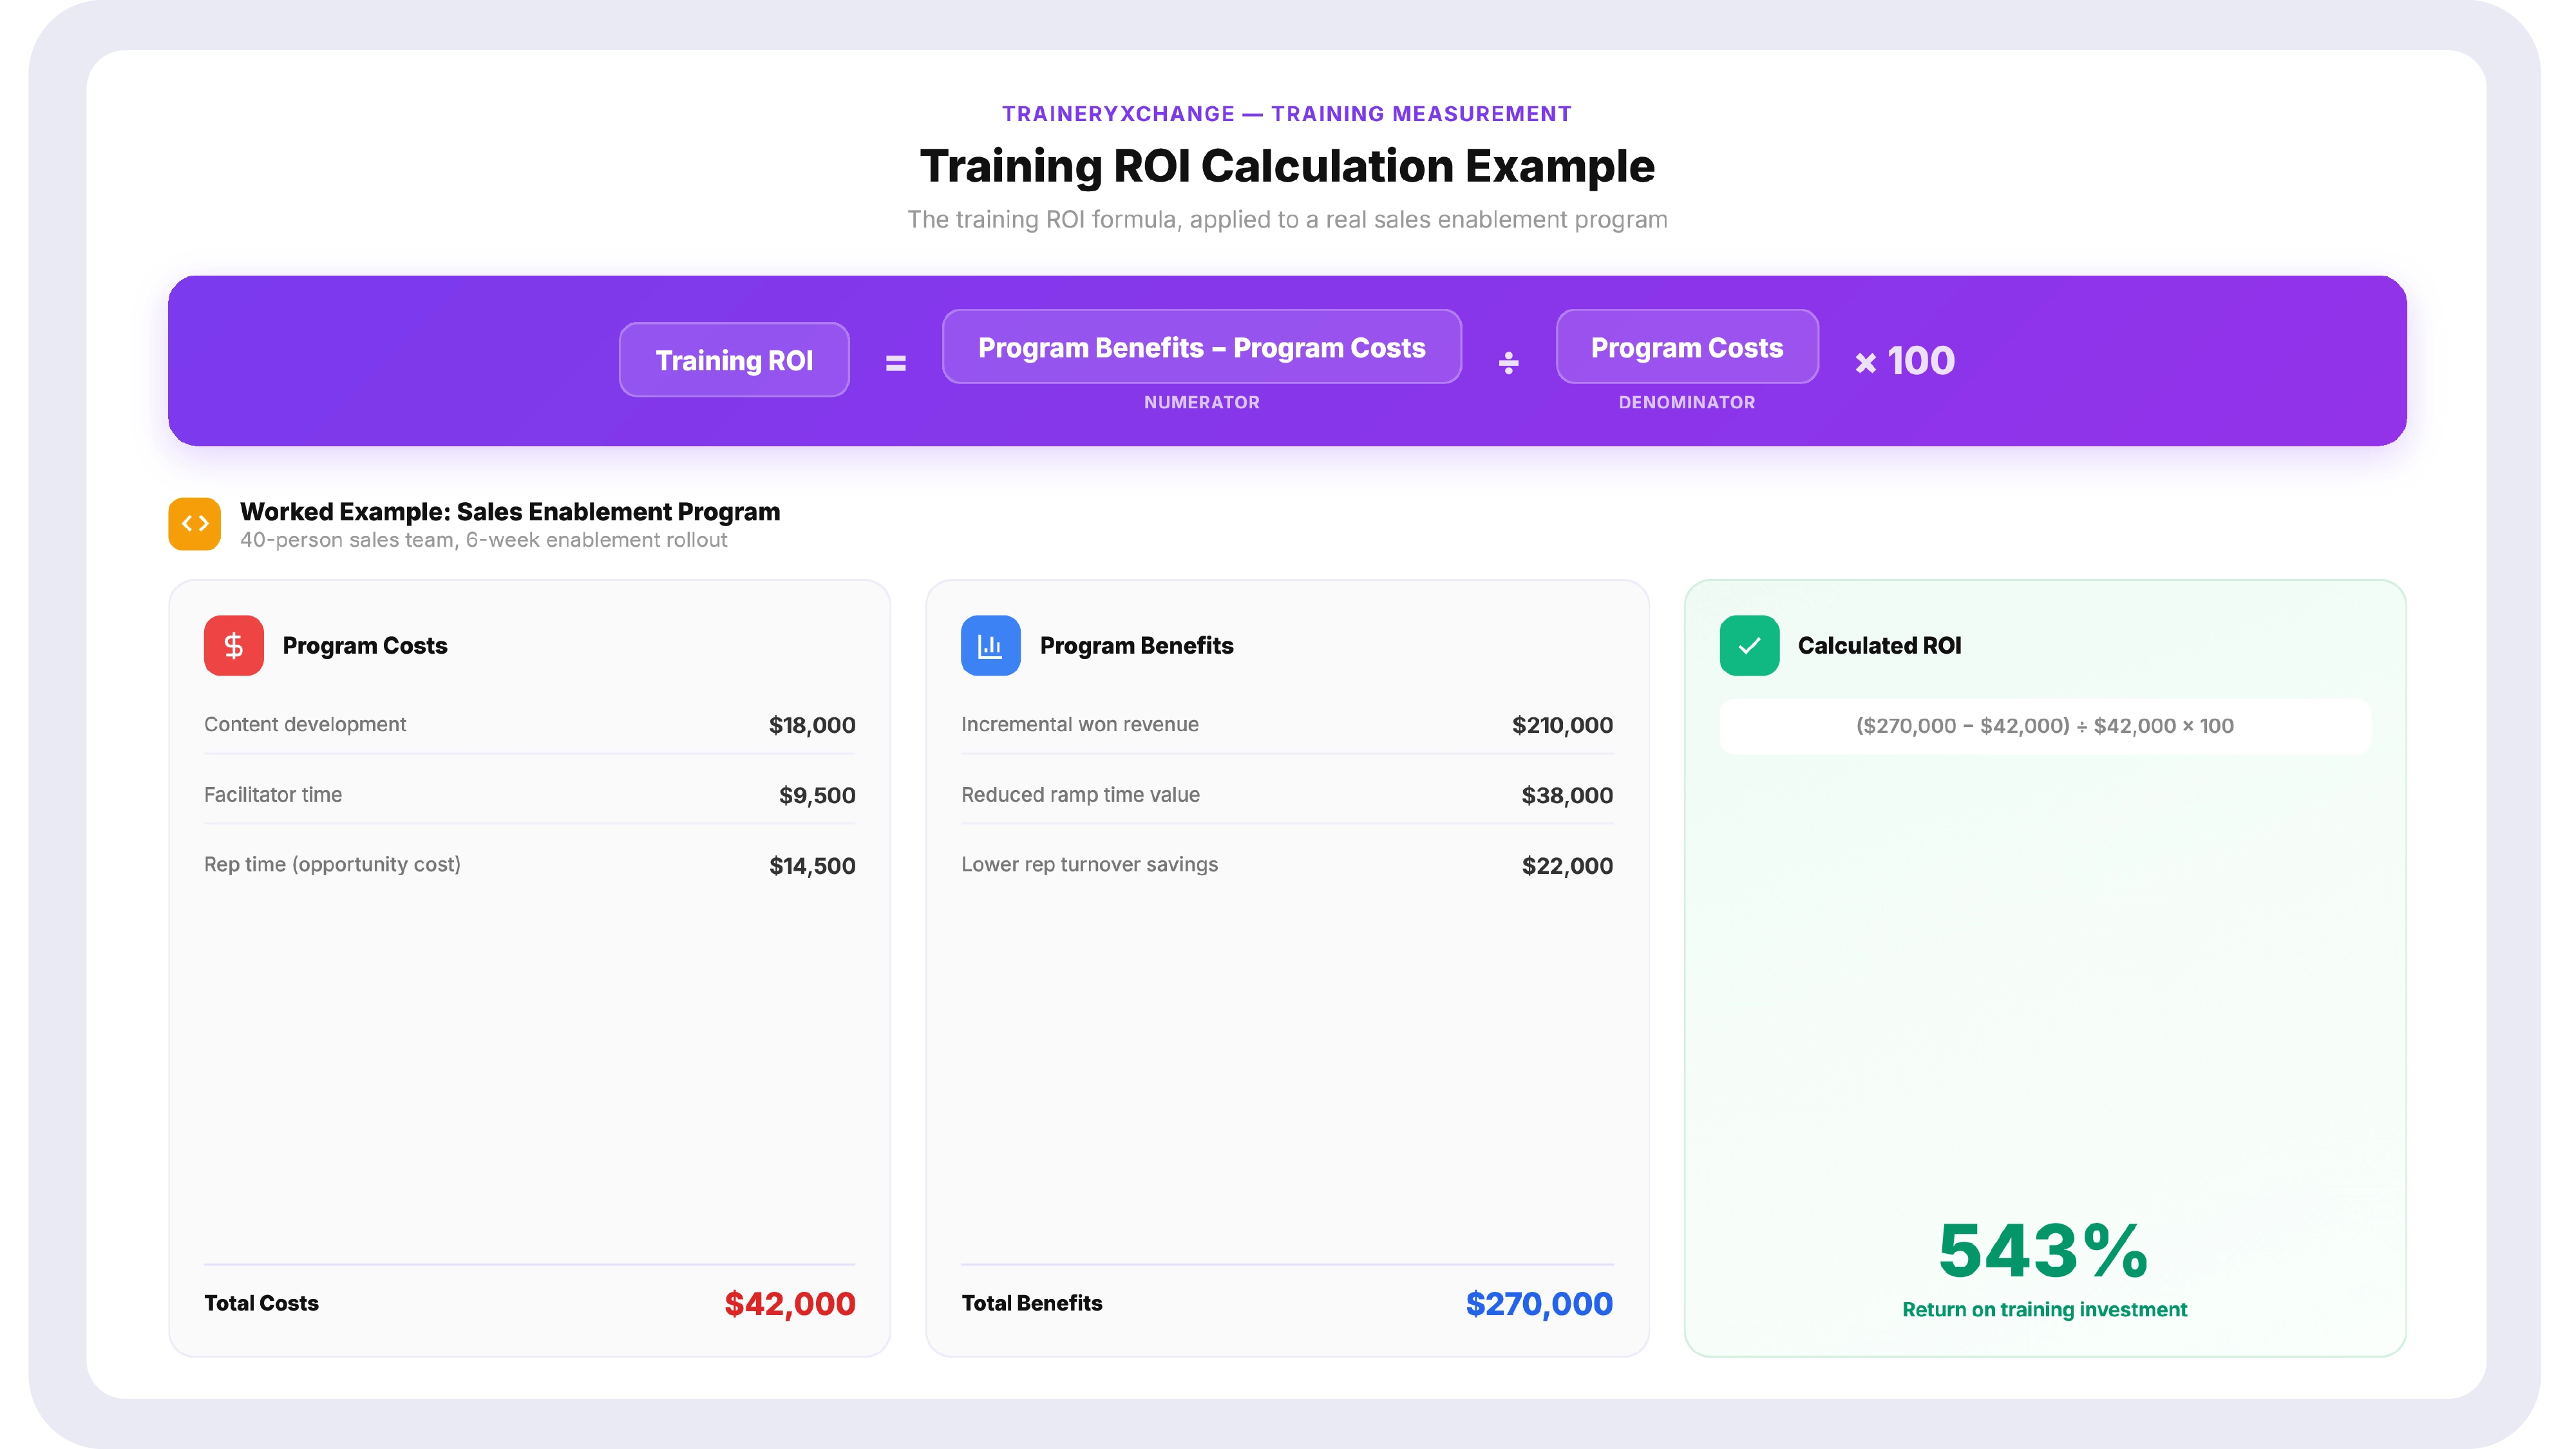
Training ROI is the metric most likely to get a budget approved or protected, and it is also the most commonly miscalculated. The formula itself is simple. The discipline is in correctly isolating the value of the improvement.
Worked example: a sales team of 40 reps completes a negotiation skills program costing 1,200 dollars per rep, for a total program cost of 48,000 dollars. In the 90 days following training, the average deal close rate rises from 22 percent to 27 percent. Applied against average deal value and pipeline volume, that lift translates to an additional 210,000 dollars in closed revenue attributable to the trained cohort, isolated against a control group that did not receive the training in the same period.
ROI = [(210,000 − 48,000) ÷ 48,000] × 100 = 337.5 percent.
The step most teams skip is the control group comparison. Without isolating the trained group's performance against a comparable untrained group over the same period, it is impossible to separate the effect of training from seasonal demand, market conditions, or other variables. A training ROI number without a control comparison is a correlation, not a calculation that finance will trust.
Turn ROI calculations into an automatic dashboard view
Calculating training ROI by hand for every program, every quarter, does not scale past a handful of cohorts. TraineryXchange's reporting layer connects completion, assessment, and certification data automatically, so the inputs to a calculation like the one above are already sitting in your dashboard instead of buried across three exports. Book a demo to see automated training ROI reporting
Executive Dashboard vs. L&D Dashboard: Which Metrics Matter to Whom
A common design mistake is building one dashboard and showing it to every audience. Executives and L&D practitioners are asking different questions of the same underlying data, and a dashboard trying to satisfy both usually ends up too dense for one and too shallow for the other.
| Dimension | Executive Dashboard | L&D Operational Dashboard |
|---|---|---|
| Primary Question | Is training investment delivering measurable business value? | Where is training breaking down right now? |
| Core Metrics | Training ROI, performance improvement, and certification compliance rate. | Completion rate, abandonment rate, time to complete, and quiz pass rate by module. |
| Refresh Cadence | Monthly or quarterly. | Real-time or weekly. |
| Level of Detail | Aggregate trends, cross-program comparisons, and executive summaries. | Drill down by course, learner, cohort, manager, department, and location. |
How to Build a Real-Time Training Dashboard Using LMS Data
- Identify the business goals each training program supports, and group KPIs accordingly using the business-goal table above rather than a generic universal metric list.
- Confirm your LMS or content platform captures the outcome metrics, not just completion. Many platforms log completion natively but require assessment scoring and manager sign-off workflows to be configured separately for retention and competency data.
- Build two dashboard views from the same data source: one aggregate executive view refreshed monthly, one drill-down operational view refreshed in real time.
- Set threshold alerts on the metrics with compliance or safety exposure, such as certification rate dropping below a defined percentage, rather than relying on someone remembering to check.
- Establish a control group practice for any program where ROI will be reported, so the dashboard can show a credible before-and-after comparison rather than a single number with no baseline.
Common Training Dashboard Mistakes to Avoid
- Reporting completion rate as the headline metric with no outcome data behind it makes a struggling program look successful.
- Building one dashboard view for both executives and L&D practitioners, resulting in a report too dense for leadership and too shallow for the team running programs day to day.
- Calculating training ROI without a control group produces a number that collapses under the first finance question about causation.
- Tracking aggregate completion across the whole company without breaking it down by department or location, which hides the specific compliance gaps that actually carry risk.
- Treating learner satisfaction as a vanity metric instead of a leading indicator, missing the early warning signs of declining engagement.
- Manually exporting data from multiple systems every reporting cycle instead of connecting KPI tracking directly to the LMS, which guarantees the dashboard is always at least a few weeks stale.
How an Enterprise Learning Platform Automates KPI Tracking
Every mistake in the list above traces back to the same root cause: the data needed to build a real training dashboard lives in three or four disconnected places, and somebody has to manually reconcile it every reporting cycle. An enterprise learning platform with built-in analytics removes that reconciliation step entirely.
From manual export to automatic reporting
When completion, assessment, and certification data all flow through the same platform that delivers the training, the dashboard updates as learners progress, rather than waiting for someone to pull and merge spreadsheets at the end of the month. This is the difference between a dashboard that shows last quarter's reality and one that shows what is happening this week.
Connecting course content to outcome data
A learning platform with a deep content library and native reporting can tie specific courses directly to the outcome metrics they are meant to influence, so a drop in quiz pass rate on a specific module is visible immediately rather than discovered months later in an annual review.
Closing the loop between the dashboard and the action
The most useful dashboards do not just display data; they trigger the next step. A certification approaching expiration should automatically generate a renewal assignment. A skill gap surfaced by an assessment should route directly into a relevant learning path. That closed loop, from KPI to automatic action, is what separates a reporting tool from an operating system for training.
A training KPI dashboard earns its place on the leadership agenda when it answers more than whether people clicked through a course. The fifteen metrics covered here, grouped by activity and outcome and mapped against the specific business goal each training program serves, give HR and L&D teams a defensible answer to the question that matters: did this training change anything real?
The practical next steps are straightforward. Stop reporting completion rate in isolation. Group KPIs by business goal rather than treating compliance, onboarding, and sales training as interchangeable. Calculate ROI with a control group, not a single before-and-after number. And separate the executive view from the operational view so each audience gets the level of detail they actually need.
The business outcome that follows is measurable: training budgets that survive review cycles because they can show a number, compliance gaps caught before an audit instead of during one, and an L&D function that walks into the budget conversation with evidence instead of an attendance sheet.
Stop building this dashboard by hand every quarter
TraineryXchange combines a 10,000-plus course library with native analytics that track completion, assessment scores, and certification status automatically, deployable to your existing LMS or ours. Whatever stage your training reporting is at, the next step is making the data work for you instead of the other way around. Start your free trial or book a demo today
Book a Demo




%5B1%5D.svg)
